Learning Objectives
- Identify sources of satellite images
- Download and use several software packages to open, examine and process different types of images and remote sensing information.
Prerequisites
- Knowledge of computers and patience.
- Preferred: knowledge of how use a command line utility, especially for Linux/Unix.
Introduction
This workshop introduces several tools for examining, processing and analyzing satellite images. Having your own laptop will be beneficial, since you can download and install the applications and files during the workshop and help each other. Be warned that some of these files and applications are large. Having at least a few gigabytes of free disk space is a necessity.
Google Earth
Google Earth provides an easy way to get free satellite imagery, although what is freely available is quite limited in terms of time frequency and resolution.
- Go to the Google Earth website and download Google Earth.
- Open Google Earth.
- Click on the button to the right of the magnifying glass to see panels.
- Choose the Layers panel to see available satellite images and sources.
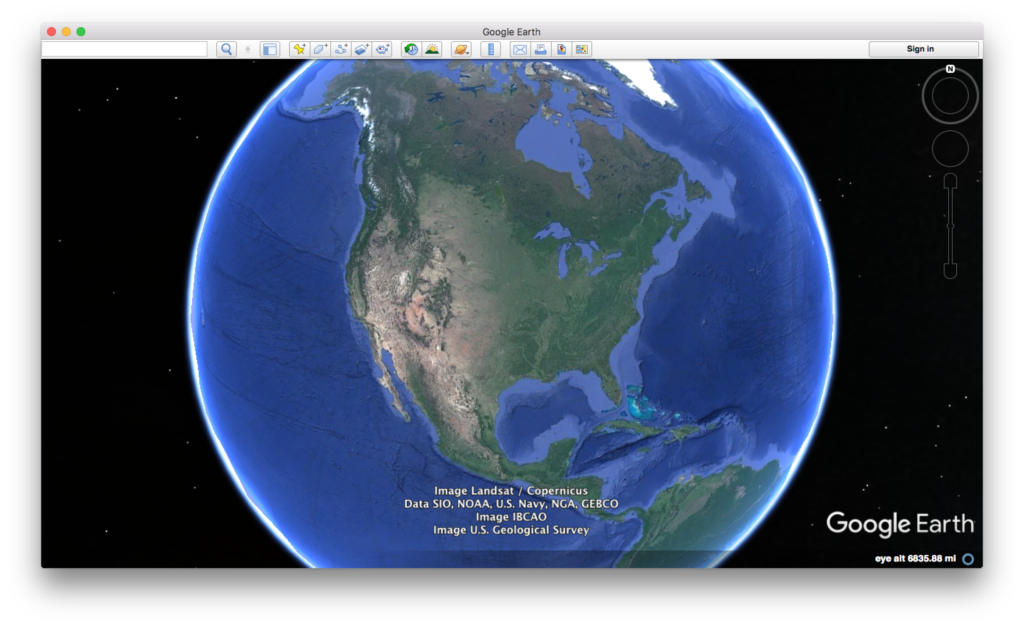
Credit: Google Earth
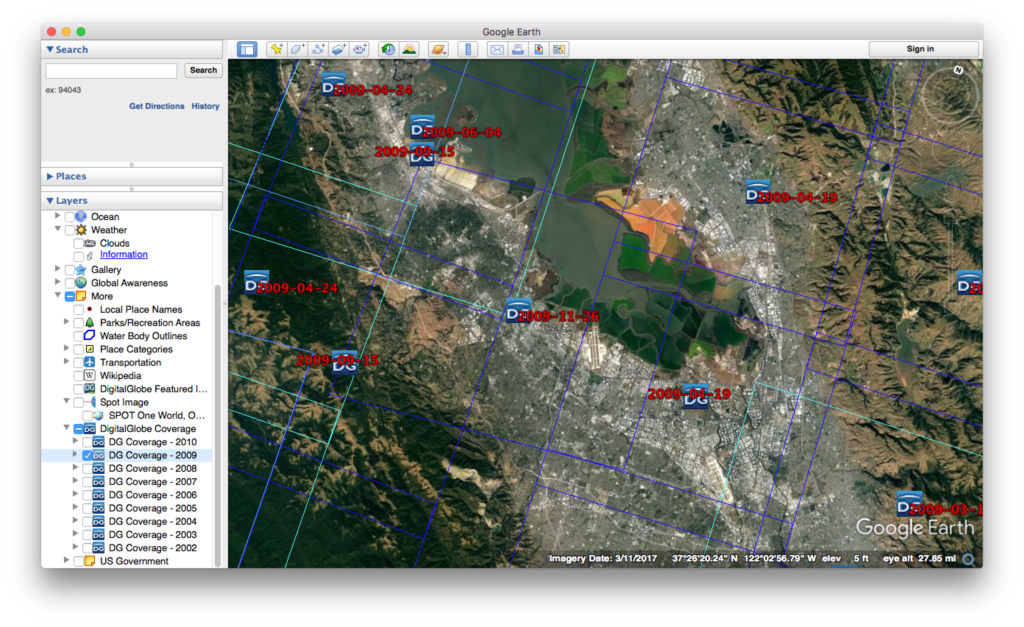
Credit: Google Earth
ESA Sentinal
There are five ESA Sentinel missions, each of which concentrate on different capabilities.
-
- First sign up for a Copernicus account using Open Hub.

Copernicus main page
- Let’s look at visible images (some infrared bands might be available)
- Install the Sentinel 2 – Toolbox
- Obtain an image through Copernicus.
- Load the image into the toolbox.
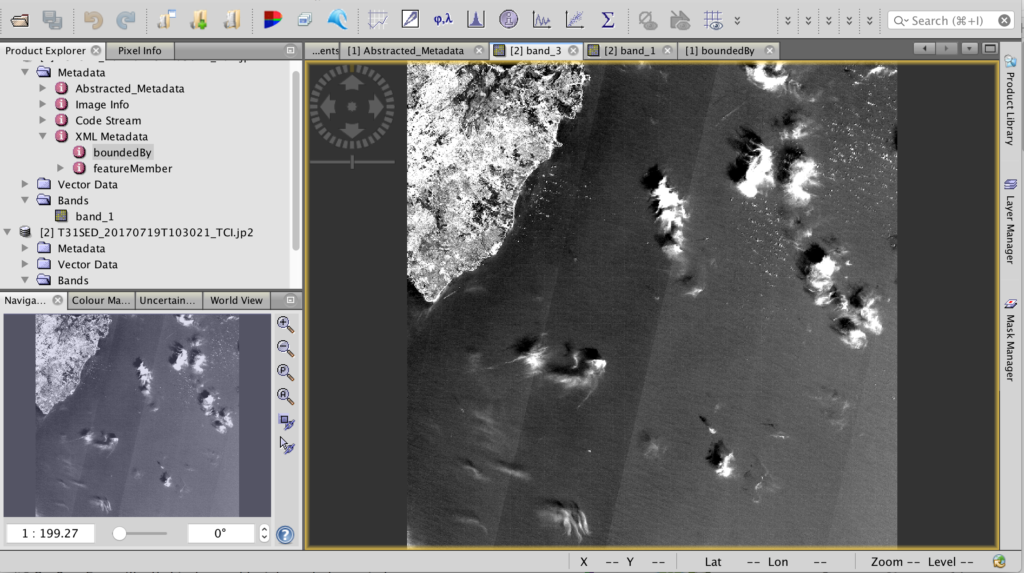
Sentinel Toolbox 2
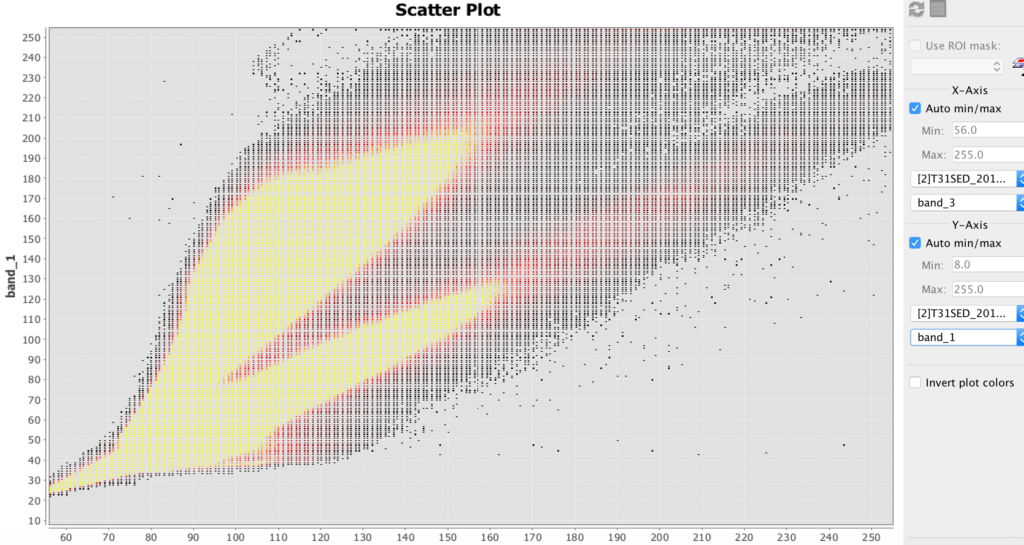
Sentinel Toolbox 2 scatter plot example
HDF
- HDF stands for hierarchical data file. It is used for some remote sensing files.
- Install HDFview for hierarchical data files (.h4, .h5, etc.)
- Download this file: BUV-Nimbus04_L3zm_v01-00-2012m0203t144121.h5.txt
- Open up this file in HDFview.
Processing Images Using Python
You can process images by using the Python programming language. The Python Image Library (PIL) makes some analysis relatively easy. UPDATE: this workshop is will be moving towards the PILLOW package, since PIL is no longer supported.
- Make sure that you have a text editor on your computer. It should be able edit and save pure text. Applications such as MS Word are not very good at this. Applications such as Xcode or Textmate are suitable.
- Make sure you have a terminal application on your computer. It might be called Terminal or HyperTerminal. If not, install a terminal program for your computer.
- Make sure that you have Python 1.5.2 or newer installed on your computer. To check, open your terminal application and enter python –version
- If you need to get or upgrade Python, click here.
- Download, uncompress and move the file to your working directory: PIL_test.py
- Run that file in your terminal with the command python PIL_test.py
- If the file says that PIL or Image are missing, download the library from here. (PIL installation can be challenging. Use Google to find additional sources of help for your operating system).
- PIL documentation can be found here.
- Download and unzip this file: Image_Processing_Example_01
- Run the file and practice changing the parameters. (See comments in file.)
Hyperspectral Images and Analysis
Hyperspectral allows you to determine the materials viewed with much greater precision than most other methods. The amount of hyperspectral imagery available (especially for free) is quite limited, but the quantities should greatly increase in the next few years due to new missions by Satellogic and Planetary Resources.
The best way to learn how to use hyperspectral images is to download the TNPmips GIS software and go through the hyperspectral tutorial on that site.
- TNTmips is GIS software that has a hyperspectral analysis component. There is a free version.